Network Effects And Cascading Behaviour
The phenomenon of spreading through networks and cascading behaviors is prevalent in a wide range of real networks. Examples include contagion of diseases, cascading failure of technologies, diffusion of fake news, and viral marketing. Formally, an “infection” event can spread contagion along main players (active/infected nodes) which constitute a propagation tree, known as a cascade. In this section, we study how a infection propagates through a network. We will look into two classed of model, namely decision based models and probabilistic models. But first lets look at some terminology used throughout the post.
Terminology
- Cascade: Propagation tree created by spreading contagion
- Contagion: What is spreading in the network, e.g., diseases, tweet, etc.
- Infection: Adoption/activation of a node
- Main players: Infected/active nodes, early adopters
Decision Based Models
In decision based models, every nodes independently decides whether to adopt the contagion or not depending upon its neighbors. The decision is modelled as a two-player coordination game between user and its neighbor and related payoffs. Hence a node with degree plays such games to decide its payoff and correspondingly its behavior.
Single Contagion Model
There are two contagions and in the network and initially every node has behavior . Every node can have only one behavior out of the two. The payoff matrix is given as:
| A | B | |
|---|---|---|
| A | a | 0 |
| B | 0 | b |
Lets analyze a node with d neighbors, and let p be the fraction of nodes who have adopted . Hence the payoff for is and payoff for is . Hence the node adopts behavior if (threshold)
Case Study: Modelling Protest Recruitment on social networks
Key Insights:
- Uniform activation threhold for users, with two peaks
- Most cascades are short
- Successful cascades are started by central users
Note:
k-core decomposition: biggest connected subgraph where every node has at least degree k (iteratively remove nodes with degree less than k)
Multiple Contagion Model
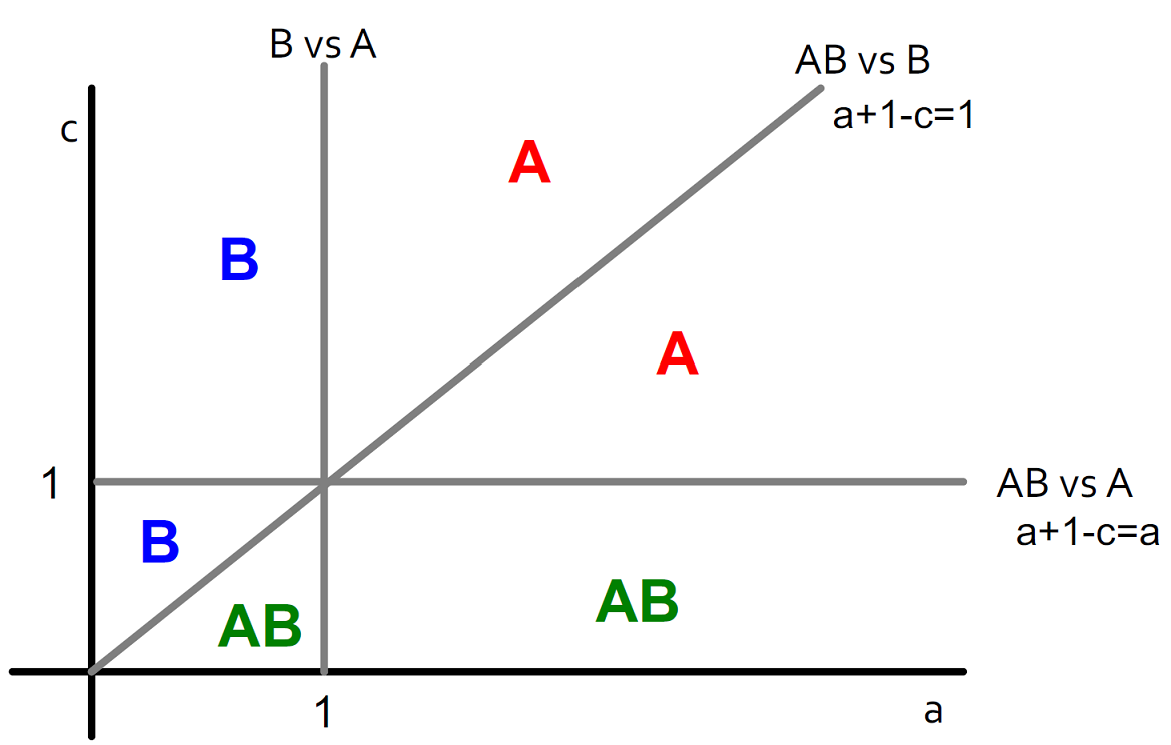
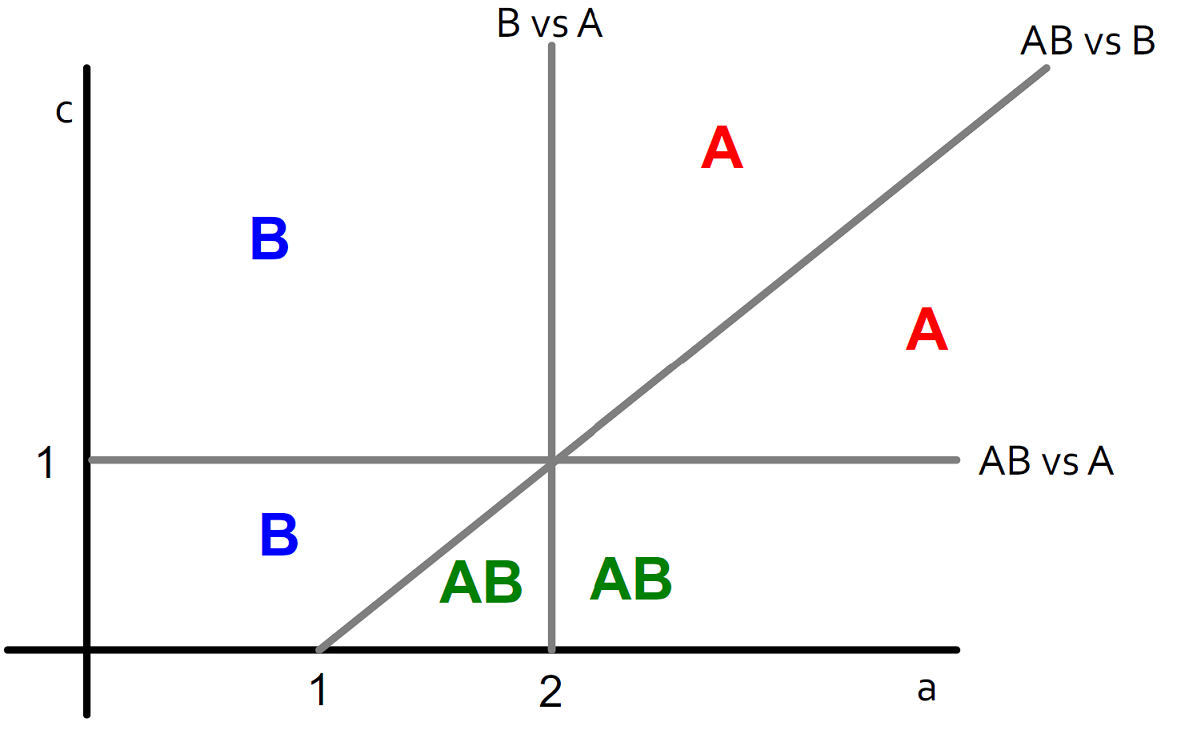
There are two contagions and in the network and initially every node has behavior . In this case a node can have both behavior and at a total cost of (over all interactions). The payoff matrix is given as:
| A | B | AB | |
|---|---|---|---|
| A | a | 0 | a |
| B | 0 | b | b |
| AB | a | b | max(a,b) |
Example: Infinite Line graph
Case 1:A-w-B

Payoffs for : , ,

Case 1: AB-w-B

Payoffs for : , ,
